
Have you ever wondered about why averages become predictable? If you go out and observe the heights of the people around you, you may find that most people are around the same height give or take because data tends to cluster around a value and that creates the average. There will be times where you do notice that some people are outliers and may either be shorter or taller than what you consider to be “average”. The math behind this seems intuitive but it’s also beautiful.
When you collect a sample of something and calculate the average, you find the mean of that sample size. In statistics, there’s a theorem called The Central Limit Theorem (CLT) that states as the sample size increases, the sampling distribution of the mean starts following a normal distribution. A normal distribution in this case means a bell curve shape centered around the mean.
A great example of this could be women’s heights. If you take a random sample of 10 women and calculate their heights, you may find that the average may or may not be close to the true average height for women. However, as you increase the sample size to 100, the average height will converge to the true average women’s height because the sample is becoming larger.
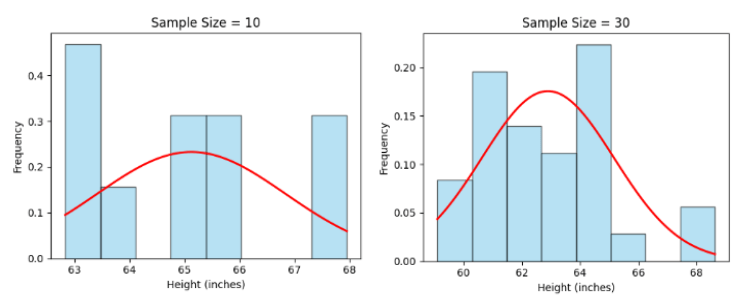
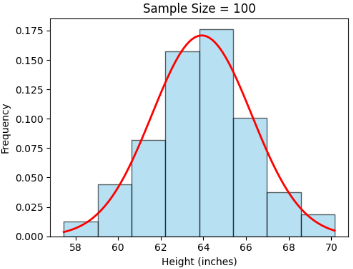
Based on the charts, the red function is a normal distribution, the greater the sample size the distribution becomes more bell-shaped. Intuitively, the more data you have, the closer you are to capturing the actual picture.
